What is a good click-through rate?
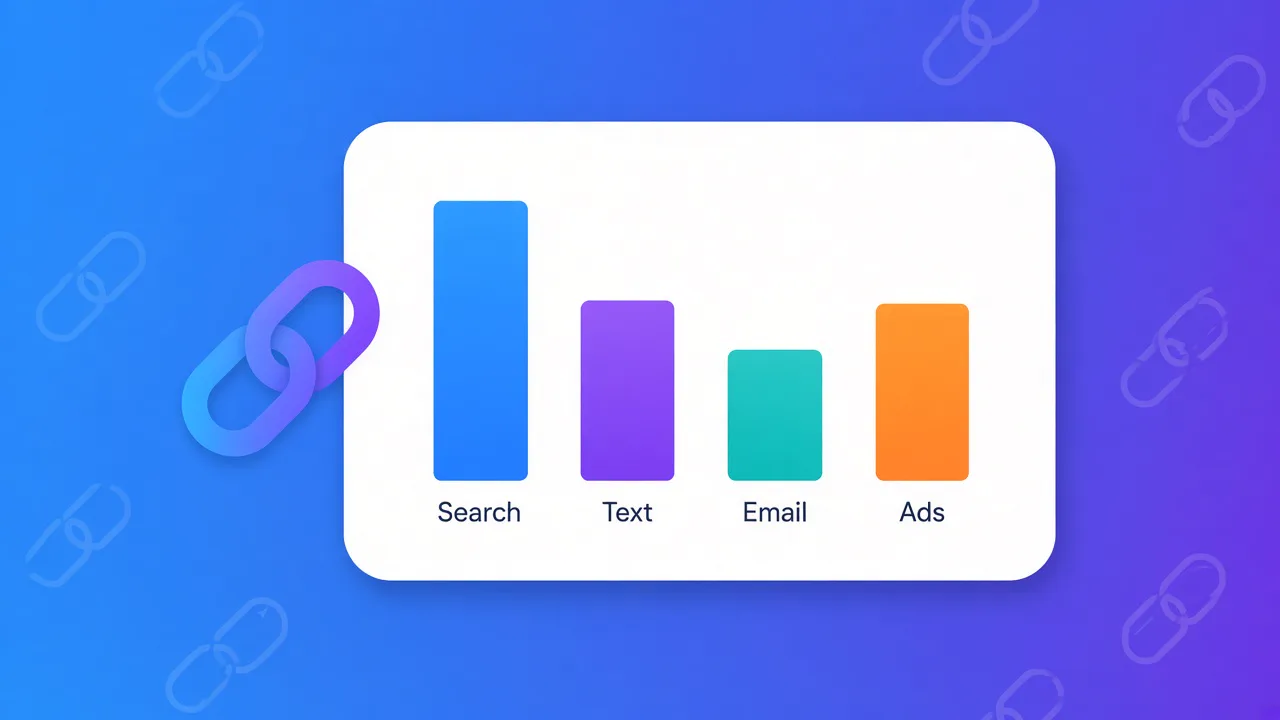
It depends on the channel. A normal search ad click rate is several times higher than a normal Facebook ad. A text message often beats an email. Here are numbers from studies you can open and read.| Channel | Click rate | What was measured | Source |
|---|---|---|---|
| Google search ads | 6.66% | Median of more than 16,000 U.S. campaigns, April 2024 to March 2025 | WordStream |
| Facebook lead ads | 2.59% | Median of U.S. campaigns, April 2024 to June 2025 | WordStream |
| Facebook traffic ads | 1.71% | Median from the same Facebook study | WordStream |
| 2.09% | Median of 3.6 million campaigns in 2025 | MailerLite | |
| SMS | 5.76% | Average click rate in Klaviyo's 2025 data | Klaviyo |
Search ads
WordStream's 2025 Google Ads benchmarks use more than 16,000 U.S. campaigns. The click-through rate is 6.66%. The average cost per click is $5.26. Arts and entertainment ads reached 13.10%. Sports and recreation reached 9.19%. Dentists and dental services were at the low end, at 5.44%. Even that low end is far above a typical social ad. People on Google are already looking. The ad answers a search. That is why the click rate is high, and why each click costs more.Facebook ads
WordStream's Facebook study covers U.S. campaigns from April 1, 2024 to June 30, 2025. Traffic campaigns, the ones built to send people to a site, had a 1.71% click rate. That was up from 1.57% the year before. The average cost per click on those traffic campaigns was $0.70, far below the $5.26 search click. Lead campaigns had a 2.59% click rate. The spread by industry is large. On traffic campaigns, shopping, collectibles, and gifts hit 4.13%. Travel was 2.76%. Sports and recreation was 2.60%. Automotive repair was 0.80%. Physicians and surgeons were 0.83%. Finance and insurance was 0.98%. Instagram and LinkedIn numbers move around by study, ad type, and country. Copying one Instagram percentage from a roundup blog will mislead you. Run the ad, then read your own link clicks. Marketing on Facebook and marketing on LinkedIn cover the posting side. Ad spend shows why a small rate change matters. DataReportal, citing Statista, says worldwide social media ad spend was on track to reach $277 billion in 2025, up 13.6% from the year before. Search ad spend was projected at $352 billion. The source is the Digital 2026 Global Overview.Text messages
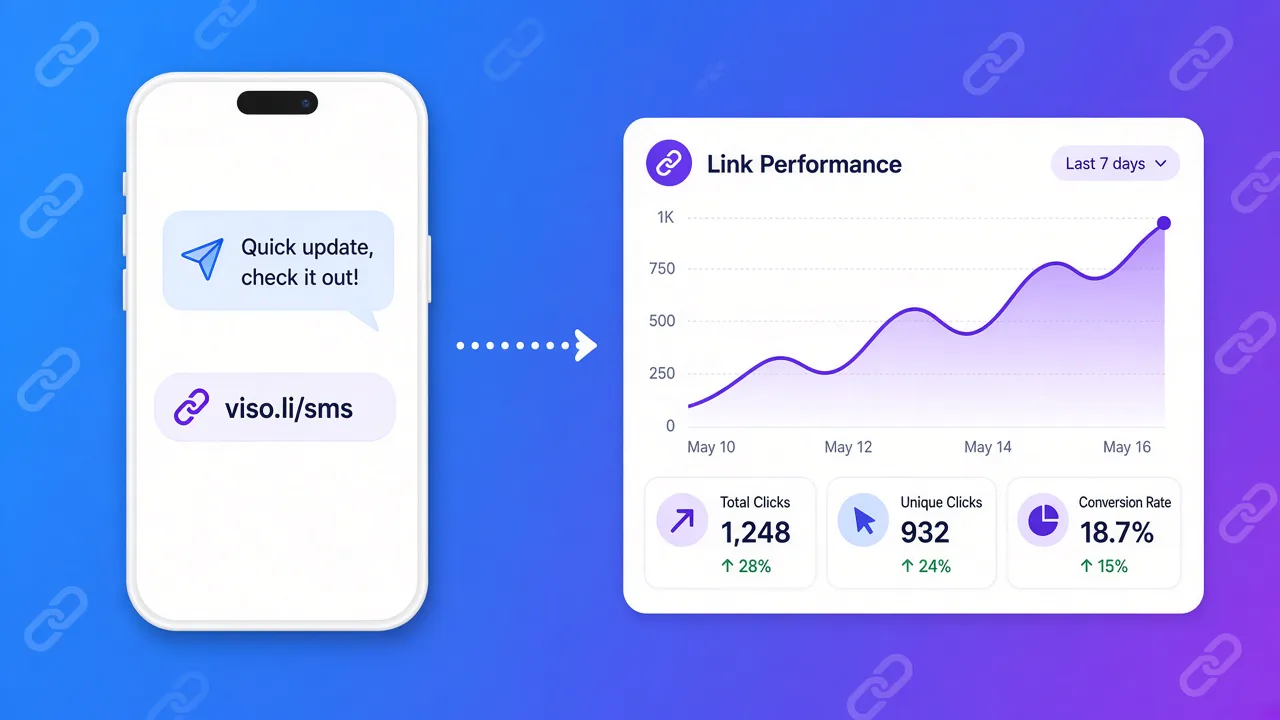
Klaviyo's measured SMS average was 5.76%, against 1.29% for email in the same write-up. A SimpleTexting survey found many businesses reporting 21% to 35%. The gap is the method. One study counted clicks. The other asked people what they remembered. SMS click rates explains both numbers.Offline clicks and profile links
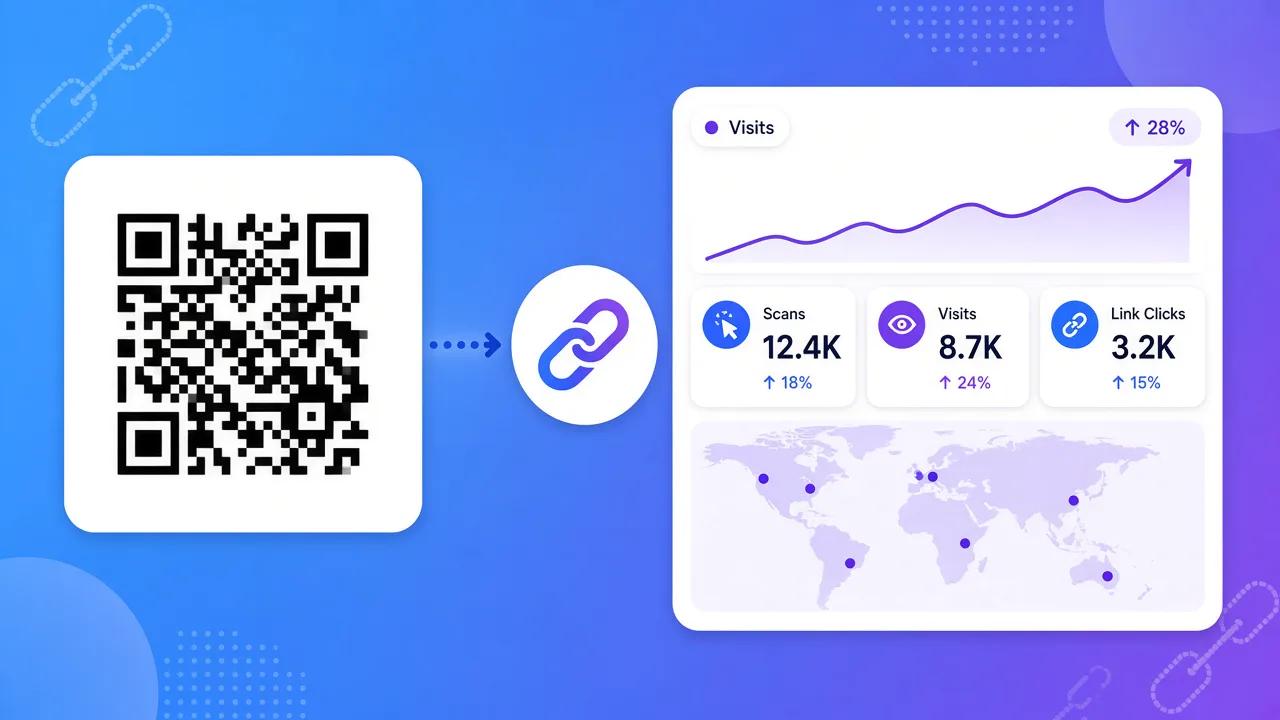
QR codes and bio links do not show up in ad reports. More than half of adult internet users scan a QR code in a month. Bio links on Instagram, TikTok, and YouTube need their own tracked URL. If you mix those clicks into one long website address, you cannot tell a poster from a profile.How to beat a benchmark you do not control
Public averages mix industries, budgets, and lucky days. A fair test is smaller:- One short link per channel. Email, text, ad, bio, and QR code each get their own link.
- The same destination page, so the offer is not the thing that changed.
- Read visits, visitors, country, and device.
- Keep the winner. Change the loser.
One offer, four links
Say you launch a workshop. You use the same signup page everywhere, with a different short link in each place.| Place | People who could see it | Clicks | Click rate |
|---|---|---|---|
| Email to 1,000 people | 1,000 delivered | 24 | 2.4% |
| Text to 200 people | 200 delivered | 18 | 9.0% |
| Facebook traffic ad | 4,000 impressions | 60 | 1.5% |
| Printed poster QR | unknown views | 35 | not a CTR |